Now you might think that means Tier 1 is automatically your best bet for profits, but hold on.
CPM stands for “cost per mille” (cost per thousand impressions). It’s what you pay to show your ads 1,000 times. Think of it as the price tag on getting eyeballs on your iGaming offers. Higher CPM means you’re paying more for each view.
But here’s where it gets interesting. The highest CPM doesn’t always mean the best return on your investment. (Yes, this can be counterintuitive at first.)
Why does this matter for your iGaming business? To put it simply, when you spend money on traffic, you need to know where each dollar yields the highest return.
All too often, operators get caught up chasing premium Tier 1 traffic because the CPM rates look very appealing, but then wonder why their budgets disappear faster than chips at a blackjack table.
Well, the reality is more nuanced. To break it down:
- Tier 1 markets command premium prices for good reasons.
- Tier 2 markets might give you better scaling opportunities.
- Tier 3 can provide the volume you need to test and learn.
We’re going to unpack the real CPM numbers across all three tiers and explain why these differences exist, and most importantly, help you figure out which tier best tailors to your specific situation.
Whether you’re working with a $5,000 monthly budget or $500,000, the tier strategy you choose can make or break your campaigns.
Ready to move beyond the surface-level CPM numbers and get into what actually drives profits?
Traffic Tier Classifications and Current CPM Rates
What Defines Each Traffic Tier
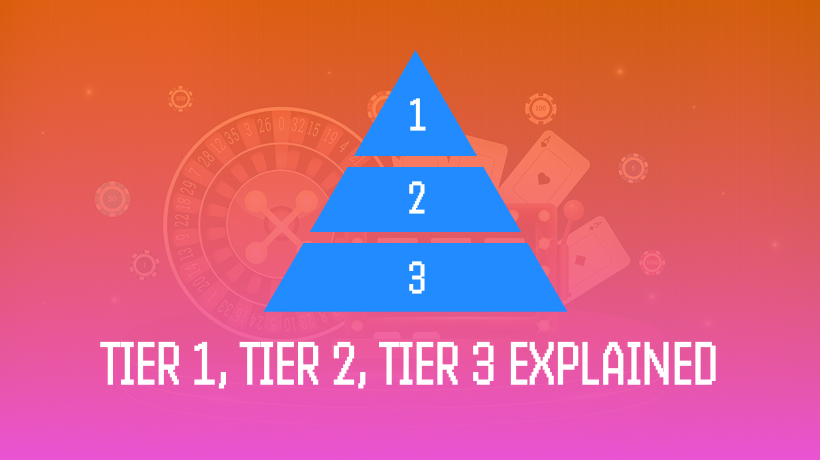
Traffic tiers aren’t just random categories, as they are based on fundamental economic factors that closely impact how much users spend and how they behave online. To explain with the following examples:
Tier 1 countries: These nations have high GDP per capita (usually $40,000+), excellent internet infrastructure, and widespread credit card usage. We’re talking about the US, Canada, Australia, most of Western Europe, and a few premium Asian markets like Japan and Singapore. These users have disposable income and are comfortable spending money online.
Tier 2 markets: Markets that sit in the middle ground with GDP between $10,000-$40,000. These markets include Eastern Europe (Poland, Czech Republic), emerging Latin American countries (Brazil, Argentina), and developing Asian economies (Malaysia, Thailand). These markets have growing internet penetration and expanding payment options, but users are more price-conscious.
Tier 3 countries: They typically show GDP under $10,000, with high mobile dependency but limited traditional payment methods. Examples include India, Indonesia, Philippines, most of Africa, and parts of Latin America. Users here often rely on mobile money or cash-based systems.
The key difference? It’s not only about wealth, but also about digital payment habits, internet infrastructure quality, and how comfortable people are with online transactions.
2024-2025 CPM Rate Comparison
The numbers indicate what advertisers are willing to pay for different audiences.
| Ad Format | Tier 1 CPM | Tier 2 CPM | Tier 3 CPM |
|---|---|---|---|
| Premium Display | $15-40 | $8-20 | $3-8 |
| Push Notifications | $3-8 | $1-4 | $0.3-1.5 |
| Pop Ads | $2-5 | $0.5-3 | $0.3-1 |
| Domain Redirect | $5-15 | $2-8 | $1-3 |
According to Match2One’s 2025 analysis, these rates have increased 5-12% since 2021, with premium placements seeing the sharpest growth at 12%.
The gap is dramatic since you might pay $30 CPM for premium display ads in Germany, while the exact format costs just $5 CPM in Thailand or $2 CPM in the Philippines.
Real Industry Numbers
RichAds data revealed that push ad pricing starts at $0.005+ CPC in Tier 1 markets, translating to those higher CPM equivalents. Whereas for Tier 3 markets, push ads can start as low as $0.001+ CPC.
Here’s what’s driving the increases:
- Fraud rates jumped 64% year-over-year in 2024, making quality traffic more expensive.
- Advertisers are beginning to pay premiums for verified, clean traffic sources.
But there’s also good news. Industry analysis from Adsterra revealed that CPM inflation is expected to moderate in 2025-2026, falling from 3.4% to around 2.5% as the market stabilizes.
The takeaway: Tier 1 commands the highest rates due to real value in user quality and spending power. But whether that value translates to profits for your campaigns depends on several factors.
Why CPM Rates Differ Significantly Between Tiers
Economic Factors Drive Pricing
The main driver behind these CPM differences? It’s simple economics. Tier 1 users have significantly more money to spend, and they spend it differently.
According to Risk.inc’s iGaming analysis, Tier 1 players commonly deposit $100+ monthly and stay active for 12+ months, creating lifetime values (LTV) 3-5 times higher than Tier 3 markets.
| Market Tier | Avg Monthly Deposit | Retention Period | Estimated LTV |
|---|---|---|---|
| Tier 1 | $100+ | 12+ months | $1,200+ |
| Tier 2 | $30-80 | 6-10 months | $300-600 |
| Tier 3 | $10-30 | 3-6 months | $50-150 |
When a single customer can generate $1,200+ in lifetime value, paying $30 CPM makes sense. You’re not just buying impressions, you’re buying access to high-value users.
Infrastructure differences matter too:
- Tier 1 markets have seamless credit card processing and established e-wallet systems.
- Tier 3 markets often rely on mobile money or cash-based deposits, creating friction that affects spending behavior.
Competition and Market Maturity
In Tier 1 markets, multiple well-funded operators compete for limited high-quality ad inventory, driving prices up significantly. The regulatory complexity adds another challenge. Licensing in markets like the UK or Germany often requires $500,000+ in fees, concentrating demand among fewer qualified advertisers.
RichAds notes that premium traffic sources increasingly avoid unlicensed operators, preferring legitimate, verified partnerships.
Meanwhile, Tier 3 markets have abundant inventory and fewer barriers, resulting in lower costs and less competition.
Quality vs. Volume Trade-offs
Tier 3 markets often have higher conversion rates (up to 5-15%) versus Tier 1’s 1.8-6.5%. However, these conversions reflect different motivations. Tier 3 users tend to see gambling as income, signing up quickly but depositing small amounts and churning faster.
Tier 1 conversions come from users with disposable income, showing lower initial conversion rates but far higher long-term value and retention.
Ultimately, quality usually beats quantity for profitability.
Choosing the Optimal Tier for Your Business Goals
When Tier 1 Makes Sense
Tier 1 works for operators with deep pockets and long-term plans. Success requires significant capital and regulatory expertise.
You should target Tier 1 when you have:
- Monthly budgets of $50,000+ for testing
- Proper licensing in target jurisdictions
- Premium tracking and compliance tools
- Advanced fraud detection systems
- Partnerships with quality traffic sources
Industry data shows Tier 1 requires CPA targets of $200-300 per customer compared to $10-50 in Tier 3. This makes sense when lifetime value exceeds $1,200 per customer.
Tier 2: The Sweet Spot for Growth
Tier 2 offers the best balance of cost, competition, and opportunity. GR8 Tech’s CRO calls these regions “the new battlegrounds of iGaming.”
Why Tier 2 works for scaling:
- Moderate CPM rates ($8-20) with good user value
- Lower competition than Tier 1
- Faster regulatory approvals
- Growing payment infrastructure
- Opportunities for cultural localization
Brazil is a standout example, with legal sports betting expected to reach $10 billion by 2029 after regulation began in January 2025.
Adsterra’s Thailand case study showed a 325.6% ROI, generating $5,235 from a $1,230 spend through Social Bar CPM optimization.
Tier 3 Volume Strategies
Tier 3 is best for testing and large-volume campaigns. Ultra-low CPC starting at $0.005 makes scaling affordable.
Tier 3 success requires:
- Mobile-first ad formats
- Educational marketing strategies
- Automation tools
- High-volume processing
- Cultural localization and sensitivity
The Philippines BingoPlus campaign achieved over 200% ROI using mobile interstitial ads.
Budget allocation examples:
- Conservative: 60% Tier 3, 35% Tier 2, 5% Tier 1
- Aggressive: 40% Tier 1, 45% Tier 2, 15% Tier 3
The Bottom Line: CPM Is Just One Piece of the Puzzle
Tier 1 traffic has the highest CPM rates, but high prices don’t always mean the best profits. The right question is, “Which tier delivers the best ROI for my situation?”
Decision framework:
- Begin with Tier 1 if you have $50,000+ monthly budgets and compliance expertise.
- Focus on Tier 2 for scalable growth and balanced risks.
- Use Tier 3 for testing, learning, and volume-based strategies.
Markets evolve fast. Brazil is moving from Tier 2 to Tier 1, while African markets like Nigeria and South Africa grow through mobile-first adoption.
Industry analysis shows successful affiliates mix all three tiers strategically, leveraging each for different business goals.
Next step: Test each tier with $500-1,000 budgets before scaling. Then double down on what delivers actual profit, not just high CPM numbers.

